Valiant Technology Ltd

Feedback Form
Data Logger User manual

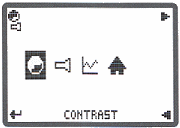
This option allows you to make adjustments to the way SenSci operates, the display type and 'battery status'.

'Settings' to access the following menu;.

    Contrast
    Sound
    Graph Type
    Home

Explore the sub-menu with thebuttons and enter your choice with.

Settings menu: contrast highlighted

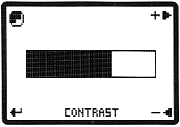
'Contrast' to adjust the screen appearance

  • Useto increaseto decrease andto exit.

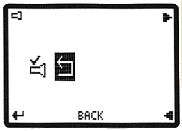
'Sound' to activate or deactivate sound.

  • Use scroll keys to highlight between 'Sound On/Off' and 'Back'
  • With 'Sound On/Off' highlighted,to toggle between On and Off.
  • To exit highlight 'back' and.
Contrast bar screen
Sound on/off screen

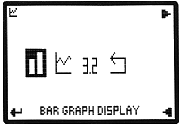
'Graph Type' to access the following modes;

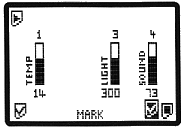
  • Bar Graph Display: Displays data as a filled portion within a percentage bar representing the overall range of the sensor, the numeric value is displayed under the bar (accurate to 4 significant figures). This mode is available for all metering and Logging options..
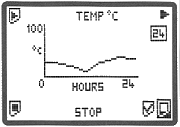
  • Time Graph: Displays data as a line graph - data on the y-axis against time on the x-axis. Once the maximum number of points are displayed the graph scrolls along. This mode is available for all Logging options and Metering contimuously.
Graph type menu: bar graph highlighted
Bar Graph display
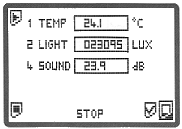
  • Numerical Data: Displays data in a numeric format, this mode allows data to be viewed to six significant figures and up to six sensors to be viewed simultaneously. This mode is available for all Metering and Logging options..
  • Explore the display options with thebuttons and enter your choice with.

'Home' to return to the main menu.


Graph type menu: bar graph highlighted
  © 2004. Amethyst Consultancy Ltd.